Small Business Acquisitions Reach Q1 2019 Levels as Sellers Return; Inflation Weighs Heavy
- Business owners motivated by retirement versus macro headwinds
- Private equity expands in the small business acquisition space
- Service sector sustains market growth, while retail and restaurants catch up
- Inflationary pressures and labor shortages continue to impact profitability
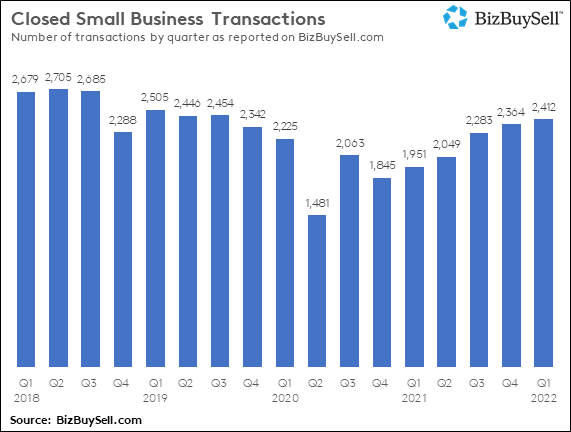
Business for sale transactions experienced steady growth in the first quarter of 2022, rising 24% over the previous year and just 3.7% shy of Q1 2019, long before COVID-19 shocked the market. This according to BizBuySell's Insight Report, which tracks and analyzes business-for-sale transactions and sentiment of business owners, buyers, and brokers.
Buying and selling activity has been rising at a steady pace since dropping 39% in Q2 2020 when swaths of Main Street businesses were shuttered during the U.S. pandemic lockdown. Moreover, median sale prices continue to sit at record levels, up 6% over the previous year to $345,000.
Over the past two years, buyers have consistently snatched up a constrained supply of businesses that have thrived during the pandemic. However, the tides are now shifting as more sellers enter the market.
More Business Owners Deciding to Sell, Majority Retiring
An increasing number of small business owners, many aging and no longer willing to wait on the sidelines, believe now is the time to exit. Of owners recently surveyed, the majority (55%) cite retirement as motivation for selling, while a substantial 31% say their business is doing well and they can receive a good price now. In fact, active for-sale inventory has climbed 10% over the past year. Interestingly, macro-economic factors such as future COVID spikes and recession fears were least cited as a reason for selling.
Of surveyed owners, over 63% say they are over 50 years old and 30% say they are over age 60. More than a third (37%) say they plan to sell within 2 years. This long anticipated ‘Silver Tsunami’ wave of retiring Baby Boomers appears to be arriving and is expected to supply the market with a steady stream of available businesses throughout the year.
Robert A. Flynn, Managing Member of United Brokers Group, LLC in Rhode Island explains the influx of aging business owners looking sell, “The number of sellers this year is steady compared to 2021. But the average age of our seller is now higher (closer to 70 versus 65 years of age). Seller's health issues (or their spouse's) are increasingly driving the decision to sell.”
Sheila Spangler of Murphy Business Sales in Idaho describes how the market is changing, “I am working with almost twice as many seller clients this year than in the prior two years. Owners that have been “fence-sitting” have decided NOW is the time to sell. 2020 and 2021 were ’great years for deal flow for me. This year to date, has surpassed last year. And things are continuing to heat up as sellers seek to exit.”
Inflation and Supply Chain Impact Small Businesses
As the pandemic subsides and foot traffic returns to Main Street, new challenges take center stage. Small business financials reported in Q1 show resilience to inflation to owners’ bottom line. The median revenue of sold businesses in Q1 was down 5% over the previous year, with median cashflow showing a slight 2% gain. This could indicate that in-demand businesses have been successful in passing the buck to the consumer. Or that the real impact has yet to be felt.
Steve Zimmerman, President of Restaurant Realty in California mentions the impact of rising costs on restaurants specifically, “Business has improved but the profit numbers are decreasing as a result of increased food, labor, fuel and other operating expenses and operators aren't able to raise their prices adequately to offset the spiraling increased costs.”
Higher operating expenses are also a result of ongoing supply chain disruptions. Flynn shares the impact on manufacturing, “The inability to reliably purchase China-sourced products on time, and in completed orders with stable pricing, is affecting manufacturers. They cannot pass all the increased costs into their pricing. Logistics and freight expense of 10-15% of revenues can wipe out a small manufacturer's profit.”
For sold businesses, small business multiples remain fairly consistent, with revenue multiples up 4% over last year and cash flow multiples up 3%, respectively. That said, individual valuations can change quickly in this environment as highlighted by Lisa Riley, President of Delta Business Advisors, and head of the Market Pulse Report for The International Business Brokers Association (IBBA) and M&A Source.
“A client received a full price offer ($1.1M) in December 2021. Within the following 2 months, the seller experienced several supply chain issues and cost of goods (COGs) increases. The buyer and seller agreed to a revised price (mid-$800K) in mid-February. The very next weekend, the seller lost a top customer. This led to another reevaluation due to lost future income and thus a reduction in purchase price offered by buyer. The seller could not afford to sell at this price and achieve retirement goals,” said Riley.
Demand for Profitable Businesses Remains Strong
Even with ongoing economic uncertainty, businesses are selling at a fast pace, with the median number of days on the market down 5% to 181 days. This is slightly ahead of the 185 days in the pre-pandemic Q1 2019.
“Buyers continue to be aggressive. Turbulence creates frustration which creates entrepreneurship. On high quality opportunities we are seeing multiple strong offers,” said Max L. Friar, Managing Partner at Calder Capital, LLC.
This brisk activity reflects today’s buyers’ motivations, with 25% saying they see emerging trends or opportunities they want to capitalize on, while 25% also believe there are a variety of good businesses to choose from.
According to Spangler, today’s buyers are looking for businesses with strong earnings, steady cash flow and long-term growth potential. “They’re seeking businesses that survived/thrived during the last two years, including construction-related businesses, niche service businesses, and manufacturing - great businesses from owners who are ready to retire.”
Flynn says he is witnessing more buying in a private equity capacity, “Buyer inquiries from private equity firms are more than double from a year ago. Medical billing and Revenue Cycle Management (RCM) business models are in very high demand due to their long-term growth prospects as well as overhead consolidation opportunities.”
Service Sector Business are in High Demand
Service businesses have been more immune to pandemic disruption, some even boosted by the pandemic, and remain the most sought after among buyers. Over the past five years, the number of service businesses changing hands has grown to nearly half (45%) of all reported business transactions, compared to 37% in Q1 of 2017. In fact, 35% of buyers today say they are seeking a service business.
From healthcare and nursing facilities to automotive repair shops, car washes and laundromats, these businesses, many of which are essential, offer steady streams of income and are less likely to be impacted by economic uncertainty.
Friar comments, “Buyer demand seems to be leaning toward business services, self-storage, car washes, as well as advanced distribution services for manufacturers. There have been few of these opportunities, so buyers are flocking to them.”
Restaurants and Retailers Make Strong Gains
Restaurants are making a strong comeback, with closed transactions up 42% over the previous year. However, transactions are still down 8% from Q1 2020 levels and 22% from Q1 2019 pre-pandemic levels. This leaves more room to grow, likely amongst fine dining restaurants with fifty or more seats according to Flynn.
Median sale prices for restaurants are up 51%, jumping from $140,000 to $225,000 over the same period. As more distressed businesses recover, aging owners see this as a window to retire, while buyers see an opportunity to take over prime locations and open new concepts.
Zimmerman shares his perspective, “I am seeing operators of businesses that are turning around to pre-COVID levels and many of these operators, primarily older baby boomers are not wanting to stick around to enjoy the future profits but would rather throw in the towel and sell.”
He mentions heightened demand for take-out and delivery restaurants, plus those equipped with large outdoor seating areas, as well as any with drive-thru capabilities. Additionally, asset sales have been in consistent demand - pre-COVID, during COVID and post COVID.
Non-restaurant retailers are also climbing back. Retail transactions grew 27% over the previous year, yet still 3% down from Q1 2020 and 17% down from Q1 2019. It’s worth noting, Q1 2022 transactions dipped 8% from Q4 2021, which could be attributed to the winter Omicron coronavirus surge discouraging shoppers from going out.
Retailers, especially Main Street shops, are finding they must further rely on a strong online presence and less on foot traffic to remain competitive. With the rise of Amazon and digital acceleration during the pandemic, smaller retailers are expected to offer some sort of ecommerce component.
Flynn adds, “I’ve seen an unabated increase in listings with ecommerce functionality and low overheads.”
Small Business Market Outlook
Even as inflation and supply chain disruptions continue to be an issue, they are not expected to be enough to cause aging owners to adjust their exit timelines. After two years of struggling through the extreme of lockdowns and COVID restrictions, owners have had more than enough time to determine their next move.
However, a new variable in the economic fallout surrounding the war in Ukraine could affect small business plans. The key to a rebounding market lies with increasing availability of strong performing businesses. Any further contraction in supply chains could slow this growth. Additionally, rising interest rates will impact buyers financing.
Max Friar states, “In my opinion, sellers should be selling. I do not think it is going to be better in 12 months. Sellers are moving slowly due to increased uncertainty. While we had uncertainty last year, people largely understood what COVID was like to deal with. Now we have a war.”
These challenges, which are expected to continue through 2022 and possibly 2023, are not expected to have a significant impact on overall buyer demand. If anything, buyers will be more likely to pursue essential businesses, services businesses, and other low risk opportunities as was the case during the lows of 2020.
About the BizBuySell.com Insight Report
The BizBuySell Insight Report is a nationally-recognized economic indicator that tracks the health of the U.S. small business economy. Each quarter, BizBuySell analyzes sales and listing prices of small businesses across the United States based on approximately 50,000 businesses for sale and those recently sold, reporting changes in closed transaction rates, valuation multiples and other economic indicators for the small business transaction market. Closed transactions are reported to BizBuySell.com on a voluntary basis by business brokers nationwide. Each report includes real small business data on over 70 major U.S. markets and across 65 small business industries.
BizBuySell is the largest business for sale marketplace online, receiving over a million visitors a month. Since 1996, BizBuySell has offered tools that make it easy for business owners and brokers to sell a business, and potential buyers to find the business of their dreams. The website also features an extensive franchise directory as well as an easy-to-use business valuation tool.
NOTE: For the most recent statistics, please see the latest BizBuySell Insights Report
Back to Top
Small Business Listing Metrics by Geography for First Quarter, 2022
Key metrics from businesses listed for sale on BizBuySell.com by market for Q1 2022
| Market | # of Listings | Median Asking Price | Median Revenue | Average Asking Price to Revenue | Median Cash Flow | Average Asking Price to Cash Flow |
|---|---|---|---|---|---|---|
| Albany-Schenectady-Troy, NY | 91 | $399,000 | $800,000 | 0.74 | $150,000 | 2.95 |
| Albuquerque, NM | 65 | $550,000 | $720,000 | 1.06 | $187,400 | 3.75 |
| Atlanta-Sandy Springs-Marietta, GA | 700 | $372,500 | $624,500 | 0.84 | $150,520 | 3.06 |
| Austin-Round Rock, TX | 228 | $443,500 | $720,639 | 0.85 | $175,488 | 2.87 |
| Baltimore-Towson, MD | 232 | $399,000 | $750,000 | 0.87 | $150,000 | 3.13 |
| Birmingham-Hoover, AL | 105 | $375,000 | $707,000 | 0.8 | $135,532 | 3.52 |
| Boston-Cambridge-Quincy, MA-NH | 478 | $300,000 | $690,613 | 0.63 | $150,000 | 2.49 |
| Bridgeport-Stamford-Norwalk, CT | 140 | $390,000 | $711,501 | 0.74 | $175,000 | 2.65 |
| Buffalo-Niagara Falls, NY | 38 | $449,518 | $789,750 | 0.76 | $237,534 | 2.82 |
| Charlotte-Gastonia-Concord, NC-SC | 296 | $317,500 | $618,266 | 0.73 | $140,000 | 3 |
| Chicago-Naperville-Joliet, IL-IN-WI | 604 | $359,000 | $616,000 | 0.82 | $150,000 | 3.02 |
| Cincinnati-Middletown, OH-KY-IN | 152 | $450,000 | $809,645 | 0.78 | $184,698 | 3.21 |
| Cleveland-Elyria-Mentor, OH | 167 | $336,000 | $691,200 | 0.66 | $150,000 | 2.95 |
| Columbus, OH | 143 | $331,000 | $757,380 | 0.63 | $160,000 | 2.88 |
| Contra Costa-Alameda-Solano, CA | 195 | $360,000 | $789,000 | 0.83 | $165,000 | 2.84 |
| Dallas-Fort Worth-Arlington, TX | 1,065 | $300,000 | $539,647 | 0.86 | $134,329 | 3 |
| Dayton, OH | 63 | $425,000 | $817,548 | 0.82 | $183,506 | 3.29 |
| Denver-Aurora, CO | 542 | $375,000 | $636,988 | 0.76 | $153,016 | 2.95 |
| Detroit-Warren-Livonia, MI | 281 | $450,000 | $800,000 | 0.78 | $193,857 | 2.95 |
| Durham, NC | 46 | $412,500 | $798,468 | 0.7 | $150,400 | 2.99 |
| Fresno, CA | 36 | $624,500 | $786,671 | 0.87 | $180,000 | 3.57 |
| Greensboro-High Point, NC | 63 | $390,000 | $636,102 | 0.77 | $141,091 | 2.91 |
| Hartford-West Hartford-East Hartford, CT | 159 | $269,000 | $675,000 | 0.57 | $110,200 | 2.44 |
| Honolulu, HI | 32 | $392,500 | $597,292 | 0.79 | $158,284 | 2.57 |
| Houston-Sugar Land-Baytown, TX | 643 | $279,000 | $489,715 | 0.84 | $126,316 | 3.17 |
| Indianapolis-Carmel, IN | 139 | $349,000 | $613,161 | 0.68 | $144,475 | 2.97 |
| Jacksonville, FL | 269 | $314,568 | $554,490 | 0.85 | $146,219 | 2.78 |
| Kansas City, MO-KS | 141 | $569,995 | $814,200 | 0.72 | $214,145 | 2.94 |
| Las Vegas-Paradise, NV | 334 | $349,000 | $493,523 | 0.79 | $153,514 | 2.67 |
| Los Angeles-Long Beach-Santa Ana, CA | 1,485 | $295,000 | $540,000 | 0.78 | $139,296 | 2.84 |
| Louisville-Jefferson County, KY-IN | 85 | $299,000 | $607,729 | 0.61 | $166,000 | 2.44 |
| Memphis, TN-MS-AR | 106 | $350,000 | $754,000 | 0.63 | $191,595 | 2.38 |
| Miami-Fort Lauderdale-Miami Beach, FL | 1,334 | $375,000 | $568,213 | 0.88 | $157,223 | 3.2 |
| Milwaukee-Waukesha-West Allis, WI | 91 | $400,000 | $695,300 | 0.87 | $166,090 | 3.02 |
| Minneapolis-St. Paul-Bloomington, MN-WI | 413 | $450,000 | $698,316 | 0.88 | $174,566 | 3.16 |
| Nashville-Davidson--Murfreesboro, TN | 210 | $401,661 | $685,026 | 0.87 | $176,953 | 2.85 |
| New Haven-Milford, CT | 140 | $275,000 | $593,332 | 0.67 | $136,010 | 2.49 |
| New Jersey | 1,342 | $327,000 | $514,000 | 0.86 | $135,668 | 3 |
| New Orleans-Metairie-Kenner, LA | 73 | $399,999 | $559,334 | 0.91 | $150,708 | 3.11 |
| New York-Northern New Jersey-Long Island, NY-NJ-PA | 4,168 | $350,000 | $640,000 | 0.78 | $150,000 | 2.73 |
| Oklahoma City, OK | 128 | $299,500 | $681,917 | 0.69 | $146,496 | 2.9 |
| Orange County, CA | 485 | $260,000 | $475,000 | 0.76 | $125,000 | 2.79 |
| Orlando-Kissimmee, FL | 567 | $300,000 | $545,431 | 0.84 | $132,000 | 3.01 |
| Philadelphia-Camden-Wilmington, PA-NJ-DE-MD | 710 | $352,000 | $600,000 | 0.82 | $155,000 | 2.83 |
| Phoenix-Mesa-Scottsdale, AZ | 1,091 | $310,000 | $525,000 | 0.8 | $143,718 | 2.7 |
| Pittsburgh, PA | 174 | $422,500 | $669,508 | 0.98 | $150,000 | 3.27 |
| Portland-Vancouver-Beaverton, OR-WA | 251 | $365,000 | $609,323 | 0.79 | $152,000 | 2.92 |
| Providence-New Bedford-Fall River, RI-MA | 111 | $390,000 | $740,596 | 0.7 | $171,067 | 2.66 |
| Raleigh-Cary, NC | 167 | $299,500 | $620,715 | 0.74 | $149,292 | 2.67 |
| Richmond, VA | 151 | $350,000 | $667,122 | 0.63 | $164,036 | 2.71 |
| Riverside-San Bernardino-Ontario, CA | 505 | $299,000 | $550,000 | 0.73 | $131,317 | 2.83 |
| Rochester, NY | 66 | $420,450 | $745,645 | 0.79 | $151,800 | 3.38 |
| Sacramento--Arden-Arcade--Roseville, CA | 277 | $230,000 | $401,000 | 0.74 | $121,000 | 2.51 |
| Salt Lake City, UT | 141 | $450,000 | $667,724 | 1.06 | $168,220 | 3.31 |
| San Antonio, TX | 154 | $310,000 | $600,000 | 0.75 | $138,250 | 3 |
| San Diego-Carlsbad-San Marcos, CA | 311 | $275,000 | $594,688 | 0.71 | $142,238 | 2.55 |
| San Francisco-Oakland-Fremont, CA | 352 | $369,965 | $725,000 | 0.83 | $175,000 | 2.76 |
| San Jose-Sunnyvale-Santa Clara, CA | 152 | $412,000 | $676,174 | 0.72 | $174,354 | 2.68 |
| Seattle-Tacoma-Bellevue, WA | 339 | $350,000 | $650,000 | 0.75 | $157,980 | 2.73 |
| St. Louis, MO-IL | 328 | $342,500 | $586,378 | 0.89 | $124,500 | 3.57 |
| Tampa-St. Petersburg-Clearwater, FL | 955 | $395,000 | $651,972 | 0.91 | $151,200 | 3.1 |
| Tucson, AZ | 132 | $397,000 | $768,725 | 0.76 | $180,000 | 2.93 |
| Tulsa, OK | 89 | $439,000 | $707,200 | 0.93 | $151,370 | 3.56 |
| Virginia Beach-Norfolk-Newport News, VA-NC | 172 | $350,000 | $661,106 | 0.72 | $152,000 | 3 |
| Washington-Arlington-Alexandria, DC-VA-MD-WV | 552 | $379,000 | $750,000 | 0.69 | $160,650 | 2.86 |
| Wichita, KS | 49 | $330,000 | $570,000 | 0.96 | $145,552 | 3.67 |
| Winston-Salem, NC | 34 | $696,000 | $872,000 | 0.73 | $221,500 | 2.95 |
Closed Small Business Transaction Metrics by Geographic Market for the Full-Year 2021
Key metrics from transactions reported on BizBuySell.com by market during 2021
| Market | # of Reported Sales | Median Sale Price | Median Asking Price | Sales to Asking Price (average) | Median Revenue | Revenue Multiple (average) | Median Cash Flow | Cash Flow Multiple (average) |
|---|---|---|---|---|---|---|---|---|
| Albany-Schenectady-Troy, NY | 9 | $500,000 | $650,000 | 0.84 | $989,801 | 0.84 | $250,000 | 2.54 |
| Albuquerque, NM | 13 | $564,450 | $564,450 | 0.93 | $1,116,197 | 0.93 | $180,840 | 3.14 |
| Atlanta-Sandy Springs-Marietta, GA | 193 | $275,000 | $325,000 | 0.93 | $575,411 | 0.93 | $137,431 | 2.48 |
| Austin-Round Rock, TX | 59 | $337,800 | $337,800 | 0.95 | $757,879 | 0.95 | $153,044 | 2.42 |
| Baltimore-Towson, MD | 88 | $565,000 | $610,000 | 0.9 | $1,000,000 | 0.9 | $250,000 | 2.71 |
| Birmingham-Hoover, AL | 19 | $186,900 | $275,000 | 0.83 | $511,970 | 0.83 | $126,507 | 1.85 |
| Boston-Cambridge-Quincy, MA-NH | 157 | $380,000 | $410,000 | 0.94 | $804,000 | 0.94 | $200,000 | 2.24 |
| Bridgeport-Stamford-Norwalk, CT | 29 | $225,000 | $315,000 | 0.91 | $592,000 | 0.91 | $120,000 | 2.38 |
| Buffalo-Niagara Falls, NY | 7 | $954,000 | $982,500 | 0.97 | $1,150,000 | 0.97 | $186,657 | 4.81 |
| Charlotte-Gastonia-Concord, NC-SC | 84 | $461,000 | $499,000 | 0.9 | $767,844 | 0.9 | $233,292 | 2.54 |
| Chicago-Naperville-Joliet, IL-IN-WI | 171 | $240,000 | $275,000 | 0.87 | $565,257 | 0.87 | $121,000 | 2.46 |
| Cincinnati-Middletown, OH-KY-IN | 44 | $500,000 | $542,000 | 0.92 | $702,289 | 0.92 | $168,000 | 3.06 |
| Cleveland-Elyria-Mentor, OH | 34 | $311,138 | $267,500 | 0.94 | $582,569 | 0.94 | $102,719 | 2.54 |
| Columbus, OH | 36 | $242,500 | $337,500 | 0.85 | $605,337 | 0.85 | $148,650 | 2.32 |
| Dallas-Fort Worth-Arlington, TX | 345 | $319,000 | $350,000 | 0.95 | $526,808 | 0.95 | $150,000 | 2.74 |
| Dayton, OH | 14 | $225,000 | $295,000 | 0.9 | $506,475 | 0.9 | $107,000 | 2.43 |
| Denver-Aurora, CO | 199 | $340,000 | $349,995 | 0.94 | $785,572 | 0.94 | $142,425 | 2.49 |
| Detroit-Warren-Livonia, MI | 134 | $287,000 | $299,000 | 1.03 | $653,055 | 1.03 | $115,198 | 2.63 |
| Durham, NC | 11 | $608,250 | $611,500 | 0.98 | $795,286 | 0.98 | $194,009 | 3.03 |
| Fresno, CA | 17 | $133,000 | $157,000 | 0.96 | $270,603 | 0.96 | $61,000 | 2.26 |
| Greensboro-High Point, NC | 16 | $450,000 | $543,000 | 0.93 | $930,633 | 0.93 | $247,227 | 2.98 |
| Hartford-West Hartford-East Hartford, CT | 29 | $249,500 | $275,000 | 0.9 | $655,000 | 0.9 | $155,000 | 2.30 |
| Honolulu, HI | 6 | $87,500 | $87,500 | 0.88 | $227,151 | 0.88 | $70,000 | 1.73 |
| Houston-Sugar Land-Baytown, TX | 163 | $200,000 | $225,000 | 0.97 | $434,000 | 0.97 | $100,000 | 2.40 |
| Indianapolis-Carmel, IN | 24 | $600,000 | $700,000 | 0.87 | $1,140,000 | 0.87 | $261,782 | 2.42 |
| Jacksonville, FL | 64 | $137,500 | $130,000 | 0.98 | $285,101 | 0.98 | $102,000 | 1.92 |
| Kansas City, MO-KS | 36 | $835,000 | $862,500 | 0.92 | $1,180,607 | 0.92 | $298,619 | 2.68 |
| Las Vegas-Paradise, NV | 132 | $199,500 | $233,500 | 0.92 | $464,193 | 0.92 | $118,386 | 2.27 |
| Los Angeles-Long Beach-Santa Ana, CA | 400 | $247,500 | $282,000 | 0.91 | $492,000 | 0.91 | $120,000 | 2.42 |
| Louisville-Jefferson County, KY-IN | 15 | $566,875 | $587,000 | 0.94 | $1,099,592 | 0.94 | $277,853 | 2.70 |
| Memphis, TN-MS-AR | 21 | $258,334 | $250,000 | 0.99 | $556,296 | 0.99 | $97,897 | 2.17 |
| Miami-Fort Lauderdale-Miami Beach, FL | 385 | $250,000 | $295,000 | 0.92 | $577,365 | 0.92 | $136,686 | 2.32 |
| Milwaukee-Waukesha-West Allis, WI | 33 | $1,085,000 | $1,049,500 | 0.97 | $1,600,000 | 0.97 | $390,000 | 3.09 |
| Minneapolis-St. Paul-Bloomington, MN-WI | 133 | $500,000 | $500,000 | 1.01 | $761,463 | 1.01 | $173,867 | 2.65 |
| Nashville-Davidson--Murfreesboro, TN | 158 | $175,200 | $199,000 | 0.93 | $500,000 | 0.93 | $100,709 | 2.14 |
| New Haven-Milford, CT | 18 | $375,000 | $395,000 | 0.85 | $1,188,125 | 0.85 | $171,262 | 1.94 |
| New Orleans-Metairie-Kenner, LA | 17 | $110,000 | $110,000 | 0.95 | $316,464 | 0.95 | $62,000 | 2.26 |
| New York-Northern New Jersey-Long Island, NY-NJ-PA | 429 | $325,000 | $392,500 | 0.9 | $738,567 | 0.9 | $165,500 | 2.35 |
| Oklahoma City, OK | 36 | $375,000 | $375,000 | 0.9 | $630,000 | 0.9 | $180,594 | 2.26 |
| Orlando-Kissimmee, FL | 194 | $170,000 | $180,000 | 0.93 | $338,820 | 0.93 | $96,990 | 2.12 |
| Philadelphia-Camden-Wilmington, PA-NJ-DE-MD | 152 | $400,000 | $450,000 | 0.93 | $736,809 | 0.93 | $200,188 | 2.32 |
| Phoenix-Mesa-Scottsdale, AZ | 327 | $270,000 | $300,000 | 0.95 | $597,500 | 0.95 | $146,719 | 2.45 |
| Pittsburgh, PA | 40 | $812,500 | $882,500 | 0.91 | $1,149,521 | 0.91 | $213,938 | 3.12 |
| Portland-Vancouver-Beaverton, OR-WA | 88 | $550,000 | $595,000 | 0.92 | $883,857 | 0.92 | $190,000 | 2.41 |
| Providence-New Bedford-Fall River, RI-MA | 47 | $557,000 | $624,500 | 0.89 | $712,500 | 0.89 | $224,034 | 2.95 |
| Raleigh-Cary, NC | 83 | $275,950 | $282,500 | 0.92 | $471,233 | 0.92 | $122,283 | 2.34 |
| Richmond, VA | 45 | $300,000 | $349,000 | 0.96 | $730,000 | 0.96 | $150,000 | 2.51 |
| Riverside-San Bernardino-Ontario, CA | 147 | $225,000 | $260,000 | 0.92 | $481,000 | 0.92 | $120,000 | 2.20 |
| Rochester, NY | 26 | $250,000 | $275,000 | 0.93 | $660,612 | 0.93 | $91,825 | 2.57 |
| Sacramento--Arden-Arcade--Roseville, CA | 75 | $239,000 | $245,000 | 0.97 | $421,530 | 0.97 | $106,225 | 2.74 |
| Salt Lake City, UT | 38 | $260,000 | $380,000 | 0.9 | $542,385 | 0.9 | $129,152 | 2.61 |
| San Antonio, TX | 35 | $304,620 | $250,000 | 0.93 | $375,000 | 0.93 | $122,154 | 2.66 |
| San Diego-Carlsbad-San Marcos, CA | 108 | $235,422 | $282,000 | 0.93 | $507,527 | 0.93 | $134,954 | 2.33 |
| San Francisco-Oakland-Fremont, CA | 135 | $320,000 | $350,000 | 0.94 | $563,403 | 0.94 | $147,673 | 2.47 |
| San Jose-Sunnyvale-Santa Clara, CA | 53 | $250,000 | $299,000 | 0.93 | $700,000 | 0.93 | $146,644 | 2.57 |
| Seattle-Tacoma-Bellevue, WA | 108 | $825,000 | $857,500 | 0.98 | $1,235,100 | 0.98 | $300,000 | 2.72 |
| St. Louis, MO-IL | 29 | $608,407 | $500,000 | 1.05 | $928,902 | 1.05 | $202,500 | 2.92 |
| Tampa-St. Petersburg-Clearwater, FL | 502 | $585,000 | $599,000 | 0.97 | $624,194 | 0.97 | $181,954 | 3.24 |
| Tucson, AZ | 47 | $330,000 | $349,000 | 0.98 | $848,903 | 0.98 | $184,750 | 2.35 |
| Tulsa, OK | 21 | $430,000 | $775,000 | 0.91 | $1,062,056 | 0.91 | $275,000 | 2.56 |
| Virginia Beach-Norfolk-Newport News, VA-NC | 28 | $164,450 | $197,000 | 0.84 | $391,981 | 0.84 | $99,644 | 2.16 |
| Washington-Arlington-Alexandria, DC-VA-MD-WV | 148 | $260,000 | $300,000 | 0.92 | $720,000 | 0.92 | $125,732 | 2.46 |
| Wichita, KS | 7 | $222,167 | $325,000 | 0.89 | $1,008,318 | 0.89 | $114,492 | 3.49 |
| Winston-Salem, NC | 3 | $625,000 | $625,000 | 1 | $866,548 | 1 | $258,553 | 2.42 |
Closed Small Business Transaction Metrics by Sector for the Full-Year 2021
Key metrics from transactions reported on BizBuySell.com by sector during 2021
| Sector | Sub-Sector | Number of Reported Sales | Median Sales Price | Median Asking Price | Sales to Asking Price (average) | Median Revenue | Revenue Multiple (average) | Median Cash Flow | Cash Flow Multiple (average) |
|---|---|---|---|---|---|---|---|---|---|
| Agriculture | Greenhouses | 6 | $752,500 | $637,000 | 1.13 | $1,024,864 | 1.13 | $172,641 | 4.24 |
| Tree Farms and Orchards | 2 | $560,000 | $700,000 | 0.8 | $220,459 | 0.8 | $80,455 | 6.96 | |
| Vineyards and Wineries | 4 | $49,000 | $49,000 | 1 | $182,568 | 1 | $34,492 | 1.42 | |
| Other Agriculture Businesses | 12 | $900,000 | $650,000 | 0.93 | $1,296,000 | 0.93 | $181,000 | 4.11 | |
| Communication and Media | Magazines and Newspapers | 6 | $120,000 | $174,500 | 0.73 | $289,911 | 0.73 | $80,069 | 1.66 |
| Production Companies | 4 | $2,050,000 | $2,175,000 | 0.85 | $2,137,645 | 0.85 | $685,395 | 3.63 | |
| Other Communication and Media Businesses | 16 | $599,000 | $599,000 | 0.96 | $812,701 | 0.96 | $198,465 | 2.58 | |
| Construction | Concrete Businesses | 13 | $490,000 | $490,000 | 0.92 | $952,594 | 0.92 | $228,962 | 2.3 |
| Electrical and Mechanical Contracting Businesses | 49 | $1,000,000 | $1,010,000 | 0.95 | $1,602,840 | 0.95 | $398,830 | 2.53 | |
| Heavy Construction Businesses | 32 | $1,000,000 | $1,250,000 | 0.92 | $1,870,957 | 0.92 | $410,481 | 2.83 | |
| HVAC Businesses | 105 | $575,000 | $695,000 | 0.93 | $1,443,079 | 0.93 | $245,515 | 2.57 | |
| Plumbing Businesses | 35 | $452,500 | $599,000 | 0.94 | $1,094,611 | 0.94 | $314,746 | 2.17 | |
| Other Building and Construction Businesses | 270 | $675,000 | $695,000 | 0.95 | $1,400,000 | 0.95 | $300,000 | 2.4 | |
| Manufacturing | Auto, Boat and Aircraft Manufacturers | 10 | $700,000 | $699,000 | 0.97 | $900,000 | 0.97 | $250,000 | 3.62 |
| Chemical and Related Product Manufacturers | 4 | $1,050,000 | $1,106,000 | 0.92 | $2,183,164 | 0.92 | $290,984 | 3.91 | |
| Clothing and Fabric Manufacturers | 10 | $552,500 | $557,500 | 0.96 | $1,026,921 | 0.96 | $195,574 | 3.6 | |
| Electronic and Electrical Equipment Manufacturers | 23 | $760,000 | $800,000 | 1 | $1,300,813 | 1 | $352,128 | 3.2 | |
| Energy and Petroleum Production Businesses | 6 | $450,000 | $550,000 | 0.82 | $700,000 | 0.82 | $260,000 | 1.73 | |
| Food and Related Product Manufacturers | 25 | $499,900 | $499,900 | 0.93 | $869,015 | 0.93 | $165,260 | 3.02 | |
| Furniture and Fixtures Manufacturers | 15 | $500,000 | $512,475 | 0.9 | $1,335,762 | 0.9 | $247,942 | 2.54 | |
| Glass, Stone and Concrete Manufacturers | 12 | $1,075,000 | $1,197,500 | 0.96 | $1,315,000 | 0.96 | $343,500 | 3.23 | |
| Industrial and Commercial Machinery Manufacturers | 9 | $940,000 | $1,077,500 | 0.84 | $962,066 | 0.84 | $270,558 | 3.57 | |
| Lumber and Wood Products Manufacturers | 26 | $1,014,703 | $1,172,000 | 0.91 | $1,434,000 | 0.91 | $297,885 | 3.17 | |
| Machine Shops and Tool Manufacturers | 59 | $830,000 | $850,000 | 0.93 | $945,000 | 0.93 | $295,500 | 3.26 | |
| Medical Device and Product Manufacturers | 8 | $749,000 | $850,000 | 0.97 | $711,995 | 0.97 | $266,420 | 2.65 | |
| Metal Product Manufacturers | 53 | $758,500 | $781,000 | 0.96 | $1,031,176 | 0.96 | $295,000 | 3.06 | |
| Packaging Businesses | 4 | $7,125,000 | $7,872,998 | 0.89 | $6,919,297 | 0.89 | $1,132,611 | 6.47 | |
| Paper Manufacturers and Printing Businesses | 17 | $310,000 | $322,500 | 0.97 | $609,344 | 0.97 | $185,049 | 2.5 | |
| Rubber and Plastic Products Manufacturers | 17 | $1,525,000 | $1,525,000 | 0.96 | $1,700,000 | 0.96 | $466,149 | 3.79 | |
| Sign Manufacturers and Businesses | 31 | $328,500 | $349,500 | 0.91 | $617,896 | 0.91 | $158,090 | 2.23 | |
| Other Manufacturing Businesses | 71 | $1,070,000 | $1,200,000 | 0.95 | $1,200,000 | 0.95 | $348,886 | 3.06 | |
| Online and Technology | Cell Phone and Computer Repair and Service Businesses | 21 | $294,500 | $324,000 | 0.99 | $669,830 | 0.99 | $167,088 | 2.17 |
| Graphic and Web Design Businesses | 5 | $1,250,000 | $1,300,000 | 0.99 | $749,755 | 0.99 | $404,024 | 4.31 | |
| IT and Software Service Businesses | 35 | $650,000 | $680,000 | 0.94 | $911,563 | 0.94 | $258,553 | 2.68 | |
| Software and App Companies | 23 | $610,000 | $625,000 | 0.95 | $659,915 | 0.95 | $245,000 | 3.21 | |
| Websites and Ecommerce Businesses | 364 | $850,000 | $857,500 | 0.98 | $812,923 | 0.98 | $247,560 | 3.63 | |
| Other Online and Technology Businesses | 26 | $462,500 | $470,000 | 0.92 | $622,000 | 0.92 | $150,500 | 3.32 | |
| Retail | Art Galleries | 6 | $300,000 | $399,000 | 0.81 | $429,879 | 0.81 | $194,536 | 2.01 |
| Bakeries | 77 | $255,000 | $279,500 | 0.95 | $563,053 | 0.95 | $120,317 | 2.34 | |
| Bars, Pubs and Taverns | 206 | $285,000 | $299,450 | 0.91 | $649,913 | 0.91 | $128,347 | 2.64 | |
| Bike Shops | 13 | $466,500 | $475,000 | 0.92 | $1,384,900 | 0.92 | $290,428 | 2.04 | |
| Breweries | 12 | $540,000 | $872,500 | 0.68 | $639,786 | 0.68 | $181,573 | 3.39 | |
| Building Material and Hardware Stores | 49 | $837,500 | $809,500 | 0.94 | $1,682,068 | 0.94 | $280,416 | 3.36 | |
| Car Dealerships | 27 | $995,000 | $1,150,000 | 0.91 | $2,063,817 | 0.91 | $350,000 | 3.17 | |
| Clothing and Accessory Stores | 66 | $185,000 | $199,000 | 0.95 | $470,600 | 0.95 | $100,000 | 2.15 | |
| Coffee Shops and Cafes | 147 | $127,500 | $127,500 | 0.89 | $327,500 | 0.89 | $75,106 | 1.94 | |
| Convenience Stores | 170 | $220,000 | $225,000 | 0.92 | $619,300 | 0.92 | $113,000 | 2.38 | |
| Dollar Stores | 5 | $125,000 | $160,000 | 0.86 | $360,000 | 0.86 | $150,000 | 1.51 | |
| Donut Shops | 15 | $159,000 | $159,000 | 1.03 | $223,700 | 1.03 | $93,500 | 2.78 | |
| Equipment Rental and Dealers | 10 | $550,000 | $850,000 | 0.9 | $2,087,500 | 0.9 | $373,000 | 2.8 | |
| Flower Shops | 51 | $175,000 | $195,000 | 0.89 | $408,000 | 0.89 | $106,344 | 1.82 | |
| Food Trucks | 15 | $99,500 | $99,500 | 0.93 | $239,358 | 0.93 | $80,000 | 1.41 | |
| Furniture and Furnishings Stores | 47 | $585,000 | $500,000 | 1.04 | $1,188,577 | 1.04 | $214,821 | 2.75 | |
| Gas Stations | 233 | $385,000 | $399,000 | 0.93 | $1,584,377 | 0.93 | $131,138 | 3 | |
| Grocery Stores and Supermarkets | 63 | $500,000 | $535,000 | 0.93 | $1,561,165 | 0.93 | $305,536 | 2.31 | |
| Health Food and Nutrition Businesses | 18 | $180,000 | $185,000 | 0.96 | $550,000 | 0.96 | $103,000 | 2.25 | |
| Ice Cream and Frozen Yogurt Shops | 153 | $168,000 | $195,000 | 0.89 | $330,000 | 0.89 | $80,000 | 2.49 | |
| Jewelry Stores | 8 | $300,000 | $385,000 | 0.8 | $579,402 | 0.8 | $146,934 | 3.12 | |
| Juice Bars | 30 | $112,500 | $142,500 | 0.87 | $453,635 | 0.87 | $75,790 | 2.19 | |
| Liquor Stores | 254 | $392,500 | $405,000 | 0.96 | $1,199,051 | 0.96 | $167,500 | 3.01 | |
| Marine/Boat Services and Dealers | 16 | $404,500 | $404,500 | 0.86 | $1,251,026 | 0.86 | $191,000 | 2.39 | |
| Nursery and Garden Centers | 10 | $462,500 | $537,500 | 0.94 | $1,103,405 | 0.94 | $219,990 | 2.95 | |
| Pet Stores and Supply Businesses | 15 | $432,500 | $497,500 | 0.91 | $1,742,310 | 0.91 | $201,040 | 2.44 | |
| Pharmacies | 31 | $262,500 | $275,000 | 0.93 | $675,000 | 0.93 | $116,413 | 2.24 | |
| Restaurants | 1452 | $194,500 | $219,450 | 0.91 | $600,000 | 0.91 | $110,038 | 1.96 | |
| Smoke Shops | 52 | $107,500 | $120,000 | 0.97 | $467,167 | 0.97 | $66,495 | 1.7 | |
| Vending Machine Businesses | 16 | $82,500 | $114,450 | 0.9 | $92,788 | 0.9 | $45,642 | 2.72 | |
| Other Retail Businesses | 196 | $347,500 | $369,450 | 0.93 | $748,062 | 0.93 | $156,918 | 2.48 | |
| Service Businesses | Accounting Businesses and Tax Practices | 75 | $380,000 | $399,900 | 0.97 | $374,138 | 0.97 | $160,000 | 2.14 |
| Architecture and Engineering Firms | 16 | $749,500 | $774,500 | 0.9 | $1,020,086 | 0.9 | $292,946 | 2.7 | |
| Assisted Living and Nursing Homes | 67 | $785,000 | $950,000 | 0.98 | $408,498 | 0.98 | $136,000 | 5.05 | |
| Auto Repair and Service Shops | 271 | $400,000 | $425,000 | 0.95 | $698,804 | 0.95 | $159,699 | 2.85 | |
| Banking and Loan Businesses | 2 | $825,000 | $950,000 | 0.93 | $550,000 | 0.93 | $401,932 | 2.3 | |
| Banquet Halls | 7 | $120,000 | $135,000 | 0.88 | $200,000 | 0.88 | $120,000 | 4.02 | |
| Bed and Breakfasts | 18 | $1,350,000 | $1,350,000 | 0.83 | $328,000 | 0.83 | $173,305 | 5.91 | |
| Campgrounds and RV Parks | 14 | $1,585,000 | $1,620,000 | 0.98 | $288,178 | 0.98 | $167,535 | 9.2 | |
| Car Washes | 67 | $1,000,000 | $1,075,000 | 0.92 | $309,100 | 0.92 | $196,451 | 6.6 | |
| Casinos | 2 | $375,000 | $399,000 | 0.94 | $665,201 | 0.94 | $346,891 | 1.08 | |
| Catering Companies | 6 | $235,000 | $400,000 | 0.79 | $580,000 | 0.79 | $126,476 | 2.26 | |
| Check Cashing Businesses | 2 | $312,500 | $325,000 | 0.94 | $299,453 | 0.94 | $143,460 | 2.11 | |
| Cleaning Businesses | 137 | $199,000 | $225,000 | 0.9 | $328,470 | 0.9 | $115,000 | 2.05 | |
| Commercial Laundry Businesses | 9 | $275,000 | $295,000 | 0.95 | $198,000 | 0.95 | $112,000 | 3.04 | |
| Dance, Pilates and Yoga Studios | 14 | $90,000 | $119,000 | 0.77 | $247,429 | 0.77 | $57,400 | 1.62 | |
| Day Care and Child Care Centers | 86 | $300,000 | $349,000 | 0.88 | $468,985 | 0.88 | $124,945 | 3.19 | |
| Dental Practices | 19 | $325,000 | $325,000 | 0.78 | $460,820 | 0.78 | $113,301 | 2.43 | |
| Dog Daycare and Boarding Businesses | 22 | $375,000 | $400,000 | 0.92 | $480,000 | 0.92 | $152,000 | 3.05 | |
| Dry Cleaners | 79 | $180,000 | $225,000 | 0.9 | $320,000 | 0.9 | $100,000 | 1.98 | |
| Golf Courses and Service Businesses | 8 | $382,500 | $512,500 | 0.91 | $420,795 | 0.91 | $144,204 | 2.85 | |
| Gyms and Fitness Centers | 63 | $175,000 | $229,000 | 0.92 | $302,056 | 0.92 | $80,442 | 2.88 | |
| Hair Salons and Barber Shops | 130 | $90,000 | $118,900 | 0.9 | $251,700 | 0.9 | $68,000 | 1.68 | |
| Home Health Care Businesses | 69 | $900,000 | $1,045,067 | 0.93 | $1,410,732 | 0.93 | $298,619 | 3.07 | |
| Insurance Agencies | 34 | $336,875 | $359,375 | 0.84 | $186,846 | 0.84 | $122,129 | 3.83 | |
| Junk and Salvage Yards | 4 | $300,000 | $287,500 | 1.13 | $685,082 | 1.13 | $109,648 | 2.56 | |
| Landscaping and Yard Service Businesses | 170 | $456,250 | $449,500 | 0.95 | $676,762 | 0.95 | $185,500 | 2.35 | |
| Laundromats and Coin Laundry Businesses | 141 | $210,000 | $225,000 | 0.91 | $169,500 | 0.91 | $60,000 | 3.49 | |
| Legal Services and Law Firms | 7 | $1,083,500 | $1,225,000 | 0.92 | $1,087,500 | 0.92 | $542,500 | 2.43 | |
| Limo and Passenger Transportation Businesses | 15 | $425,000 | $475,000 | 0.9 | $754,519 | 0.9 | $213,000 | 2.34 | |
| Locksmith Businesses | 4 | $100,000 | $125,000 | 0.88 | $263,923 | 0.88 | $98,121 | 1.24 | |
| Marinas and Fishing Businesses | 10 | $665,000 | $700,000 | 0.98 | $517,183 | 0.98 | $254,609 | 2.93 | |
| Massage Businesses | 15 | $185,000 | $231,813 | 0.89 | $471,001 | 0.89 | $78,761 | 2.5 | |
| Medical Billing Businesses | 2 | $315,000 | $315,000 | 1 | $347,778 | 1 | $75,879 | 4.17 | |
| Medical Practices | 90 | $335,000 | $335,000 | 0.93 | $499,471 | 0.93 | $184,622 | 2.07 | |
| Motels | 21 | $1,400,000 | $1,495,000 | 0.95 | $300,000 | 0.95 | $186,630 | 7.09 | |
| Moving and Shipping Businesses | 36 | $405,000 | $453,000 | 0.94 | $772,000 | 0.94 | $159,165 | 2.59 | |
| Nail Salons | 43 | $126,500 | $143,725 | 0.87 | $323,231 | 0.87 | $96,500 | 1.57 | |
| Nightclubs and Theaters | 6 | $800,000 | $800,000 | 1 | $- | 1 | $200,000 | 4 | |
| Pest Control Businesses | 21 | $250,000 | $339,000 | 0.9 | $398,578 | 0.9 | $125,591 | 2.35 | |
| Pet Grooming Businesses | 35 | $140,000 | $159,000 | 0.93 | $206,226 | 0.93 | $77,305 | 1.75 | |
| Preschools | 18 | $500,000 | $700,000 | 0.88 | $466,317 | 0.88 | $170,689 | 3.89 | |
| Property Management Businesses | 61 | $300,000 | $337,000 | 0.95 | $446,081 | 0.95 | $133,648 | 2.88 | |
| Routes | 588 | $115,894 | $119,000 | 0.98 | $319,995 | 0.98 | $94,872 | 1.93 | |
| Schools | 17 | $500,000 | $540,000 | 0.87 | $454,969 | 0.87 | $175,000 | 2.9 | |
| Security Businesses | 18 | $385,000 | $499,995 | 0.86 | $761,183 | 0.86 | $203,829 | 2.19 | |
| Spas | 31 | $162,500 | $175,000 | 0.93 | $445,714 | 0.93 | $95,614 | 2.52 | |
| Staffing Agencies | 20 | $800,000 | $880,000 | 0.93 | $1,300,000 | 0.93 | $289,000 | 3.03 | |
| Storage Facilities and Warehouses | 10 | $1,600,000 | $1,600,000 | 0.93 | $1,510,970 | 0.93 | $338,461 | 3.72 | |
| Tanning Salons | 10 | $99,000 | $99,000 | 0.93 | $211,899 | 0.93 | $60,571 | 2.12 | |
| Towing Companies | 9 | $1,850,000 | $1,900,000 | 1 | $2,446,794 | 1 | $500,000 | 4.08 | |
| Travel Agencies | 4 | $225,000 | $225,000 | 0.87 | $230,480 | 0.87 | $88,312 | 2.62 | |
| Trucking Companies | 65 | $1,200,000 | $1,299,000 | 0.94 | $1,850,069 | 0.94 | $424,996 | 3.08 | |
| Waste Management and Recycling Businesses | 22 | $825,000 | $1,000,000 | 0.95 | $755,000 | 0.95 | $285,800 | 3.52 | |
| Other Automotive and Boat Businesses | 32 | $485,000 | $550,000 | 0.9 | $1,067,289 | 0.9 | $205,000 | 2.76 | |
| Other Beauty and Personal Care Businesses | 22 | $287,500 | $288,000 | 0.92 | $530,543 | 0.92 | $150,626 | 2.33 | |
| Other Education and Children Businesses | 25 | $135,000 | $155,000 | 0.88 | $217,228 | 0.88 | $84,000 | 2.16 | |
| Other Entertainment and Recreation Businesses | 62 | $279,900 | $279,000 | 0.95 | $366,719 | 0.95 | $126,966 | 2.59 | |
| Other Financial Services Businesses | 23 | $575,000 | $625,000 | 0.92 | $465,696 | 0.92 | $226,621 | 2.68 | |
| Other Health Care and Fitness Businesses | 73 | $395,000 | $499,000 | 0.94 | $711,163 | 0.94 | $190,000 | 2.74 | |
| Other Pet Service Businesses | 20 | $390,000 | $390,000 | 0.9 | $415,783 | 0.9 | $155,247 | 2.32 | |
| Other Service Businesses | 309 | $400,000 | $449,000 | 0.93 | $642,239 | 0.93 | $175,000 | 2.43 | |
| Other Transportation and Storage Businesses | 16 | $725,000 | $815,000 | 0.96 | $929,492 | 0.96 | $260,685 | 2.32 | |
| Other Travel Businesses | 8 | $660,000 | $700,000 | 0.86 | $886,000 | 0.86 | $280,000 | 2.49 | |
| Wholesale and Distributors | Durable Goods Wholesalers and Distributors | 52 | $900,000 | $899,500 | 0.96 | $1,783,883 | 0.96 | $345,121 | 2.95 |
| Nondurable Goods Wholesalers and Distributors | 29 | $420,000 | $500,000 | 0.94 | $967,958 | 0.94 | $175,493 | 3.2 | |
| Other Wholesalers and Distributors | 87 | $235,000 | $235,000 | 0.98 | $575,000 | 0.98 | $101,000 | 2.63 | |
| Other | All Non-Classifiable Establishments | 35 | $795,000 | $850,000 | 0.94 | $1,031,880 | 0.94 | $224,000 | 3.19 |
Media Contact:
Adam Debussy
BizBuySell
email: adebussy@bizbuysell.com
About BizBuySell
BizBuySell is the Internet's largest business for sale marketplace. Since 1996, BizBuySell has offered tools that make it easy for business owners and brokers to sell a business, and potential buyers to find the business of their dreams. BizBuySell currently has an inventory of approximately 48,000 businesses - spanning 80 countries - for sale at any one time and receives more than 1 million monthly visits. The site also features an extensive franchise directory as well as an easy-to-use business valuation tool. Please visit www.bizbuysell.com for more information.
BizBuySell was founded in 1996 and in 2012 became a division of CoStar Group, Inc. (NASDAQ - CSGP) - commercial real estate's leading provider of information and analytic services. CoStar conducts expansive, ongoing research to produce and maintain the largest and most comprehensive database of commercial real estate information and offers a suite of online services enabling clients to analyze, interpret and gain unmatched insight on commercial property values, market conditions and current availabilities. For more information, visit www.costar.com.