The Market is Hot: Retiring Baby Boomers and Rising Revenues Fuel Record Small Business Sales
BizBuySell.com's Second Quarter 2018 Insight Report shows a record-breaking quarter for the business-for-sale market for sales prices and completed transactions
BizBuySell.com, the Internet's largest business-for-sale marketplace, reported today a record number of small businesses changing hands in the first half of 2018. The growth can largely be attributed to a growing number of Baby Boomers exiting their business as well as improving business financials. The full results are included in BizBuySell's Q2 2018 Insight Report, which aggregates statistics from business-for-sale transactions reported by participating business brokers nationwide.
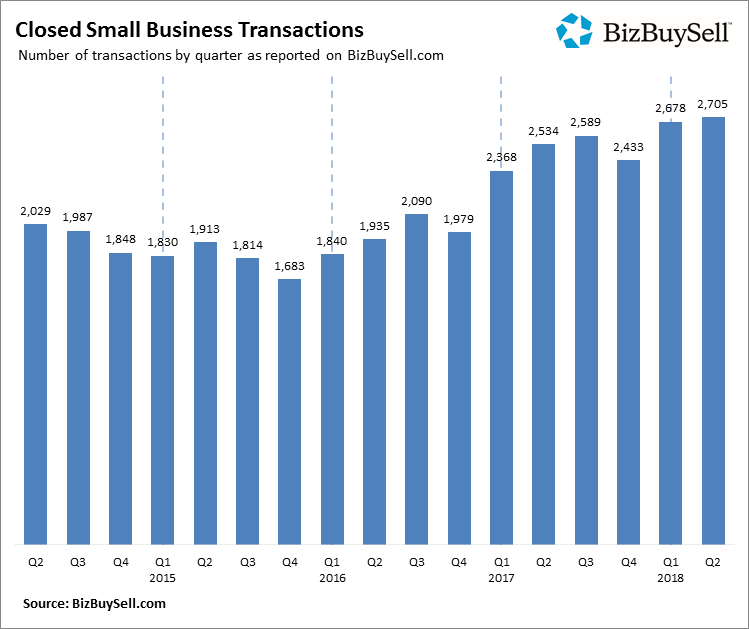
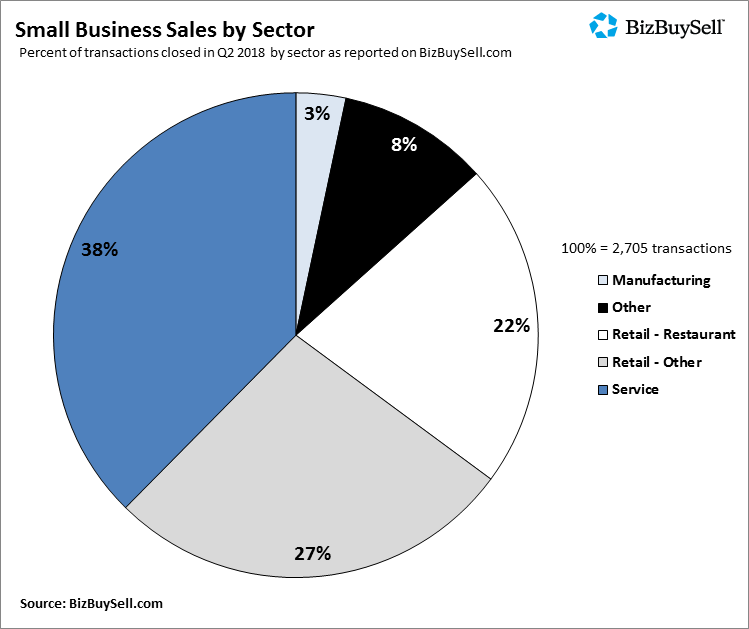
A total of 5,383 businesses were reported sold in the first two quarters of 2018, putting the year on pace to surpass 2017's record-high of 9,919 transactions. In Q2 alone, 2,705 businesses changed hands, an increase of 6.7 percent over the same time last year and the most of any quarter since BizBuySell began tracking data in 2007.
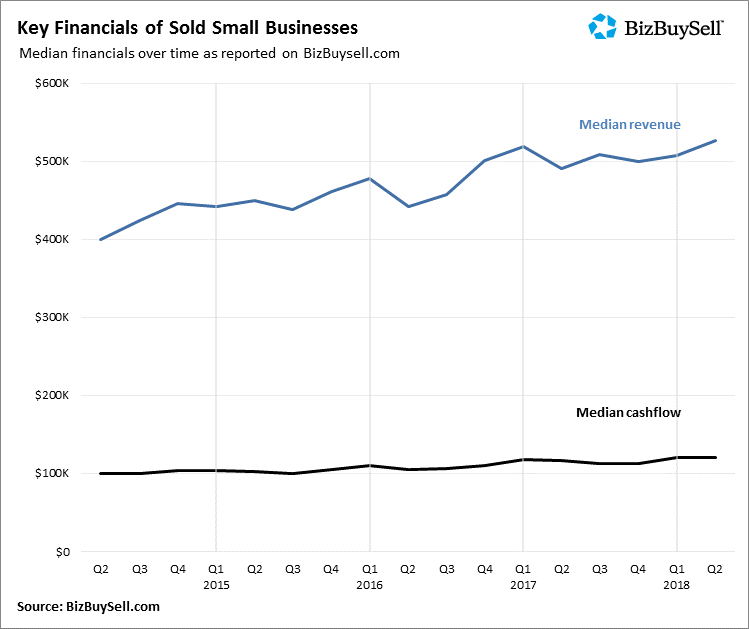
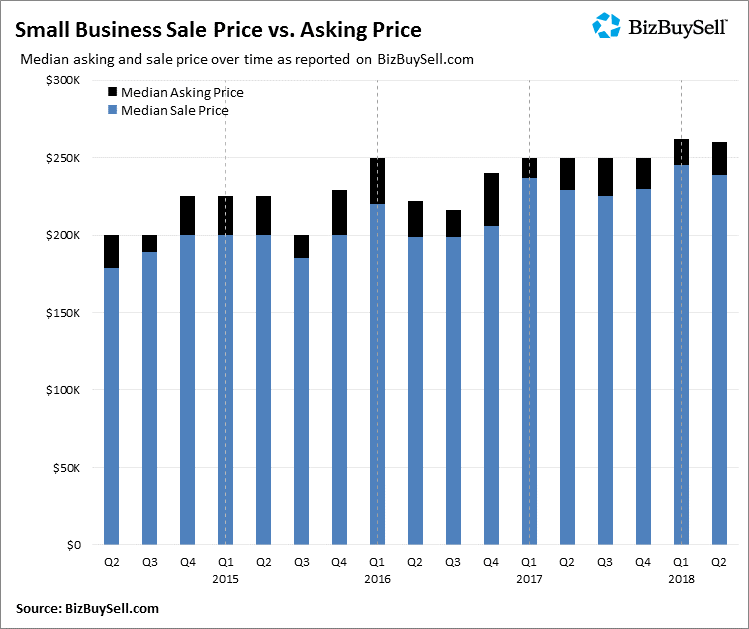
The $526,048 median revenue of businesses sold in the second quarter reached a new high with a 7.4 percent increase from last year, while median cash flow grew 3.4 percent to $120,000. These stronger financials are catalysts for gains in asking and sale prices over the past year. Asking prices increased 4 percent from Q2 of last year to $260,000, raising the median sale price 4.4 percent to $239,000.
While buyers are dishing out a little more at the negotiating table, BizBuySell data reflects a win-win for both parties. Sellers get a little extra cash from the deal, while buyers are taking ownership of businesses with better financial footing. The former is of special importance to the growing number of Baby Boomers relinquishing their business in turn for the reward of retirement.
For those yet to take advantage of the hot market, for-sale data shows that it's still an opportune time to jump in. A 5.1% increase in active listings were reported in the second quarter of 2018 compared to last year, extending a long trend that started in 2012. There are no guarantees in small business, however the state of the economy and demographic trends point to a rising tide. In fact, the National Federation of Independent Business (NFIB) small-business optimism index rose 3 points to 107.8 this past May, the second-highest level in the index's 45-year history.
"The current business-for-sale market is a great reflection of today's economic and demographic environment," Bob House, president of BizBuySell.com and BizQuest.com, said. "As America continues to see a swell of Baby Boomers reach retirement age, the market will likely continue to see a strong inventory of businesses for sale. Meanwhile those same businesses, many of which dug their way out of the last recession, now have the financial performance they need to earn an acceptable sale price."
Transactions Reflect Generational Shift as Baby Boomers Hand Businesses to Younger, More Diverse Buyers
According to BizBuySell's latest demographic survey, Baby Boomers still own the majority share (53 percent) of small businesses. Demographically, these Boomers make up a fairly consistent group, with over 82 percent Caucasian males. Two in three Baby Boomers have owned more than one business and 68 percent have owned their current business for more than 10 years. More importantly for the market, nearly 60 percent of Baby Boomers plan to sell their business within the next two years or less. Based on this data, we don't expect market supply to slow down anytime soon, but some data suggests we could see a shift in the makeup of incoming business owners.
A deeper dive into the demographics of today's market shows a transition to a more diverse group of business owners. Incoming buyers are less likely to identify as Caucasian (65 percent) than current owners as a whole (71 percent). They are younger, with the majority less than 50 years old and despite both groups leaning Republican, buyers are 25 percent more likely to be Democrats.
Politically, immigration remains a hot topic in our country but its impact on the small business community is profound. A third of buyers are non-natural born citizens, and 64 percent of these are first-generation immigrants and another 16 percent are second-generation. That's a big jump from non-natural born citizen current owners, in which just 48 percent are first generation and 10 percent are second generation.
Finally, while women still account for the minority of small business owners (22%), female owner demographics showed a younger, more diverse group as well. For example, twice the percentage of female owners are in their 20s as compared to men. In addition, twice the percentage of female business owners identify as African American compared to men.
Indicators Point to Continued Strong Pace in Second Half of Year
Overall, the rising financial performance of small businesses and the influx of sellers ready to enter the market provide for an optimistic outlook of the rest of 2018. Sellers will continue to take advantage of high sale prices and buyers will be able to find quality businesses within the large supply of listings.
"Baby boomers are trailblazers when it comes to entrepreneurship" said Bill Luce, President of Transworld Business Advisors, one of the nation's top business brokerages. "As Baby Boomers continue the strong tailwind, this market trend is sure to stay in style for years to come."
Despite the favorable setup, external factors exist that could sway the markets trajectory. For example, it remains to be seen what impact changes to the U.S. immigration policy will have on the market over the long term. The same goes for the U.S. China trade war, where tariffs could have a direct effect on the small business space.
In a potentially more favorable light, the Tax Cuts and Jobs Act passed in 2017 could cause the number of business transactions to further spike. Under the new tax law, many owners now benefit from a 20 percent deduction for qualified business income. If owners choose to re-invest those savings back into their business as early data suggests, the end result will likely be an increasing number of attractive businesses hitting the market.
"Our survey indicated 32 percent of all current small business owners plan to sell in the next two years so this trend will likely continue well into the future," House said. "It will be particularly interesting to watch the demographics of an average small business owner change and how this younger generation's new ideas will push forward an already successful small business environment."
About the BizBuySell.com Insight Report
BizBuySell.com is the Internet's largest marketplace for buying or selling a small business, with over 1.4 millionmonthly visitors. The company releases its BizBuySell.com Insight Report on a quarterly basis, reporting changes in closed transaction rates, valuation multiples and other economic indicators for the small business transaction market. Closed transactions are reported to BizBuySell.com on a voluntary basis by business brokers nationwide. To find a qualified business broker in your area, visit http://www.bizbuysell.com/business-brokers/.
NOTE: For the most recent statistics, please see the latest BizBuySell Insights Report
APPENDIX: Additional Statistics from Small Business Listings and Transactions Reported to BizBuySell
Small Business Listing Metrics by Geography for Second Quarter, 2018
Key metrics from businesses listed for sale on BizBuySell.com by market for Q2 2018
| Market | # of Businesses Listed | Median Asking Price | Median Revenue | Asking Price to Revenue (average) | Median Cash Flow | Asking Price to Cash Flow (average) |
|---|---|---|---|---|---|---|
| Albany-Schenectady-Troy, NY | 68 | $419,500 | $729,663 | 0.73 | $160,978 | 2.85 |
| Albuquerque, NM | 89 | $299,000 | $533,733 | 0.75 | $128,120 | 3.01 |
| Atlanta-Sandy Springs-Marietta, GA | 717 | $295,000 | $525,000 | 0.82 | $117,095 | 3.17 |
| Austin-Round Rock, TX | 240 | $325,000 | $515,953 | 0.84 | $120,000 | 2.95 |
| Baltimore-Towson, MD | 358 | $235,000 | $451,746 | 0.78 | $100,170 | 2.84 |
| Birmingham-Hoover, AL | 69 | $250,000 | $439,357 | 0.64 | $100,446 | 2.76 |
| Boston-Cambridge-Quincy, MA-NH | 603 | $270,000 | $584,000 | 0.64 | $125,000 | 2.59 |
| Bridgeport-Stamford-Norwalk, CT | 142 | $295,000 | $600,000 | 0.61 | $132,500 | 2.45 |
| Buffalo-Niagara Falls, NY | 36 | $352,500 | $508,500 | 0.87 | $119,675 | 3.34 |
| Charlotte-Gastonia-Concord, NC-SC | 290 | $290,000 | $537,649 | 0.69 | $111,417 | 3.02 |
| Chicago-Naperville-Joliet, IL-IN-WI | 741 | $250,000 | $500,000 | 0.87 | $110,082 | 3.20 |
| Cincinnati-Middletown, OH-KY-IN | 143 | $349,900 | $691,085 | 0.62 | $131,733 | 3.20 |
| Cleveland-Elyria-Mentor, OH | 165 | $250,000 | $575,000 | 0.63 | $119,440 | 2.72 |
| Columbus, OH | 200 | $237,000 | $540,000 | 0.57 | $114,500 | 2.50 |
| Contra Costa-Alameda-Solano, CA | 280 | $260,000 | $605,085 | 0.63 | $124,646 | 2.80 |
| Dallas-Fort Worth-Arlington, TX | 1317 | $250,000 | $444,000 | 0.86 | $104,000 | 3.17 |
| Dayton, OH | 80 | $292,500 | $506,649 | 0.88 | $104,141 | 3.22 |
| Denver-Aurora, CO | 666 | $275,000 | $500,000 | 0.78 | $110,523 | 3.23 |
| Detroit-Warren-Livonia, MI | 314 | $249,900 | $426,717 | 0.79 | $100,000 | 2.99 |
| Durham, NC | 48 | $249,750 | $515,698 | 0.69 | $107,437 | 3.17 |
| Fresno, CA | 32 | $355,000 | $781,246 | 0.90 | $128,253 | 3.43 |
| Greensboro-High Point, NC | 60 | $272,000 | $520,877 | 0.68 | $100,000 | 3.66 |
| Hartford-West Hartford-East Hartford, CT | 143 | $219,000 | $510,436 | 0.61 | $100,000 | 2.51 |
| Honolulu, HI | 20 | $174,950 | $230,838 | 0.66 | $84,766 | 2.63 |
| Houston-Sugar Land-Baytown, TX | 679 | $239,000 | $421,000 | 0.85 | $98,000 | 3.25 |
| Indianapolis-Carmel, IN | 179 | $361,792 | $601,800 | 0.67 | $139,201 | 2.79 |
| Jacksonville, FL | 356 | $199,850 | $421,334 | 0.71 | $100,000 | 2.75 |
| Kansas City, MO-KS | 188 | $295,500 | $578,171 | 0.71 | $123,828 | 3.07 |
| Las Vegas-Paradise, NV | 356 | $175,000 | $325,457 | 0.76 | $91,178 | 2.54 |
| Los Angeles-Long Beach-Santa Ana, CA | 2513 | $239,000 | $450,000 | 0.77 | $102,000 | 2.82 |
| Louisville-Jefferson County, KY-IN | 102 | $364,000 | $655,000 | 0.70 | $113,500 | 3.83 |
| Memphis, TN-MS-AR | 77 | $299,000 | $581,700 | 0.66 | $124,392 | 2.96 |
| Miami-Fort Lauderdale-Miami Beach, FL | 1903 | $279,000 | $464,287 | 0.80 | $120,000 | 2.93 |
| Milwaukee-Waukesha-West Allis, WI | 117 | $300,000 | $587,039 | 0.78 | $126,181 | 3.08 |
| Minneapolis-St. Paul-Bloomington, MN-WI | 472 | $299,450 | $592,508 | 0.71 | $112,007 | 3.15 |
| Nashville-Davidson--Murfreesboro, TN | 299 | $232,000 | $484,040 | 0.77 | $100,000 | 2.97 |
| New Haven-Milford, CT | 188 | $239,500 | $486,493 | 0.55 | $100,000 | 2.68 |
| New Jersey | 1981 | $275,000 | $480,000 | 0.75 | $120,000 | 2.87 |
| New Orleans-Metairie-Kenner, LA | 72 | $285,000 | $467,400 | 0.73 | $104,439 | 3.34 |
| New York-Northern New Jersey-Long Island, NY-NJ-PA | 6262 | $299,000 | $639,683 | 0.63 | $140,060 | 2.62 |
| Oklahoma City, OK | 119 | $295,000 | $450,000 | 0.79 | $120,000 | 3.06 |
| Orange County, CA | 714 | $199,000 | $420,000 | 0.64 | $96,000 | 2.62 |
| Orlando-Kissimmee, FL | 689 | $199,900 | $428,238 | 0.75 | $97,046 | 2.72 |
| Philadelphia-Camden-Wilmington, PA-NJ-DE-MD | 797 | $299,000 | $500,000 | 0.80 | $116,000 | 3.04 |
| Phoenix-Mesa-Scottsdale, AZ | 1270 | $199,000 | $375,500 | 0.65 | $93,768 | 2.52 |
| Pittsburgh, PA | 158 | $280,000 | $399,700 | 0.94 | $100,000 | 3.17 |
| Portland-Vancouver-Beaverton, OR-WA | 221 | $259,000 | $493,000 | 0.70 | $110,000 | 2.84 |
| Providence-New Bedford-Fall River, RI-MA | 168 | $327,500 | $603,000 | 0.73 | $123,809 | 3.17 |
| Raleigh-Cary, NC | 195 | $270,000 | $524,562 | 0.74 | $120,000 | 2.93 |
| Richmond, VA | 186 | $260,000 | $585,000 | 0.60 | $110,000 | 2.81 |
| Riverside-San Bernardino-Ontario, CA | 500 | $225,500 | $468,000 | 0.67 | $107,498 | 2.65 |
| Rochester, NY | 124 | $227,000 | $457,652 | 0.71 | $93,881 | 3.24 |
| Sacramento--Arden-Arcade--Roseville, CA | 242 | $225,000 | $449,900 | 0.67 | $105,000 | 2.54 |
| Salt Lake City, UT | 145 | $345,000 | $613,084 | 0.74 | $134,570 | 3.15 |
| San Antonio, TX | 179 | $250,000 | $410,000 | 0.86 | $100,000 | 3.30 |
| San Diego-Carlsbad-San Marcos, CA | 457 | $200,000 | $449,450 | 0.70 | $100,000 | 2.45 |
| San Francisco-Oakland-Fremont, CA | 510 | $277,000 | $600,000 | 0.75 | $131,769 | 2.83 |
| San Jose-Sunnyvale-Santa Clara, CA | 186 | $295,000 | $594,500 | 0.63 | $116,500 | 3.13 |
| Seattle-Tacoma-Bellevue, WA | 325 | $299,000 | $520,000 | 0.71 | $123,187 | 3.01 |
| St. Louis, MO-IL | 236 | $299,000 | $626,832 | 0.74 | $112,110 | 3.64 |
| Tampa-St. Petersburg-Clearwater, FL | 1035 | $219,000 | $420,000 | 0.80 | $102,139 | 2.68 |
| Tucson, AZ | 116 | $247,000 | $454,266 | 0.71 | $122,147 | 2.77 |
| Tulsa, OK | 76 | $355,860 | $693,999 | 0.74 | $115,735 | 2.96 |
| Virginia Beach-Norfolk-Newport News, VA-NC | 196 | $165,000 | $422,378 | 0.57 | $80,000 | 2.92 |
| Washington-Arlington-Alexandria, DC-VA-MD-WV | 872 | $250,000 | $550,000 | 0.62 | $120,000 | 2.65 |
| Wichita, KS | 32 | $262,000 | $578,305 | 0.73 | $76,357 | 4.36 |
| Winston-Salem, NC | 26 | $174,950 | $411,000 | 0.64 | $87,061 | 3.10 |
Source: Small business transactions reported on BizBuySell.com during Q2 2018
Return to topClosed Small Business Transaction Metrics by Geographic Market for the Full-Year 2017
Key metrics from transactions reported on BizBuySell.com by market during 2017
| Market | # of Reported Sales | Median Sale Price | Median Asking Price | Sales to Asking Price (average) | Median Revenue | Revenue Multiple (average) | Median Cash Flow | Cash Flow Multiple (average) |
|---|---|---|---|---|---|---|---|---|
| Albany-Schenectady-Troy, NY | 13 | $450,000 | $430,000 | 0.97 | $1,409,284 | 0.94 | $230,717 | 3.37 |
| Albuquerque, NM | 13 | $165,000 | $179,000 | 0.93 | $475,751 | 0.70 | $70,223 | 2.65 |
| Atlanta-Sandy Springs-Marietta, GA | 335 | $239,000 | $250,000 | 0.90 | $512,500 | 0.56 | $111,500 | 2.14 |
| Austin-Round Rock, TX | 71 | $295,000 | $297,500 | 0.96 | $601,900 | 0.67 | $147,576 | 2.52 |
| Baltimore-Towson, MD | 71 | $375,000 | $382,500 | 0.91 | $575,522 | 0.65 | $120,000 | 2.56 |
| Birmingham-Hoover, AL | 25 | $262,500 | $285,000 | 0.86 | $466,000 | 0.60 | $115,000 | 2.48 |
| Boston-Cambridge-Quincy, MA-NH | 237 | $207,500 | $239,500 | 0.89 | $544,500 | 0.46 | $124,000 | 1.96 |
| Bridgeport-Stamford-Norwalk, CT | 37 | $274,500 | $299,000 | 0.89 | $557,800 | 0.72 | $122,639 | 2.46 |
| Buffalo-Niagara Falls, NY | 9 | $383,000 | $940,000 | 0.83 | $1,279,064 | 0.67 | $170,000 | 3.71 |
| Charlotte-Gastonia-Concord, NC-SC | 93 | $422,500 | $474,500 | 0.96 | $803,655 | 0.65 | $188,777 | 2.71 |
| Chicago-Naperville-Joliet, IL-IN-WI | 259 | $240,000 | $299,900 | 0.88 | $577,000 | 0.53 | $112,000 | 2.39 |
| Cincinnati-Middletown, OH-KY-IN | 29 | $250,000 | $275,000 | 0.88 | $648,696 | 0.55 | $111,778 | 3.37 |
| Cleveland-Elyria-Mentor, OH | 29 | $224,500 | $249,500 | 0.90 | $585,586 | 0.55 | $132,370 | 2.31 |
| Columbus, OH | 54 | $162,000 | $198,000 | 0.87 | $636,384 | 0.37 | $123,281 | 2.12 |
| Contra Costa-Alameda-Solano, CA | 93 | $255,000 | $295,000 | 0.89 | $519,485 | 0.62 | $120,000 | 2.26 |
| Dallas-Fort Worth-Arlington, TX | 275 | $175,000 | $205,000 | 0.93 | $477,210 | 0.58 | $100,000 | 2.43 |
| Dayton, OH | 16 | $727,500 | $800,000 | 0.82 | $850,000 | 0.68 | $150,000 | 3.54 |
| Denver-Aurora, CO | 153 | $282,500 | $292,500 | 0.92 | $504,622 | 0.60 | $116,476 | 2.50 |
| Detroit-Warren-Livonia, MI | 115 | $185,000 | $220,000 | 0.94 | $370,000 | 0.62 | $90,000 | 2.42 |
| Durham, NC | 13 | $400,000 | $510,000 | 0.81 | $1,557,898 | 0.28 | $174,054 | 2.03 |
| Fresno, CA | 14 | $220,000 | $220,000 | 0.94 | $657,000 | 0.51 | $217,000 | 1.59 |
| Greensboro-High Point, NC | 14 | $189,500 | $224,500 | 0.91 | $782,330 | 0.52 | $146,340 | 2.45 |
| Hartford-West Hartford-East Hartford, CT | 41 | $116,250 | $129,350 | 0.84 | $426,059 | 0.46 | $65,000 | 1.91 |
| Honolulu, HI | 2 | $76,000 | $58,000 | 1.31 | $180,648 | 0.42 | $78,072 | 0.97 |
| Houston-Sugar Land-Baytown, TX | 131 | $180,000 | $205,000 | 0.92 | $356,400 | 0.61 | $96,667 | 2.06 |
| Indianapolis-Carmel, IN | 52 | $372,500 | $472,500 | 0.93 | $824,087 | 0.64 | $151,500 | 2.70 |
| Jacksonville, FL | 55 | $187,000 | $198,000 | 0.92 | $436,147 | 0.54 | $87,604 | 2.01 |
| Kansas City, MO-KS | 49 | $360,000 | $400,000 | 0.91 | $620,000 | 0.77 | $151,664 | 2.53 |
| Las Vegas-Paradise, NV | 121 | $149,500 | $164,500 | 0.89 | $424,212 | 0.49 | $100,283 | 1.77 |
| Los Angeles-Long Beach-Santa Ana, CA | 764 | $200,000 | $217,500 | 0.91 | $439,921 | 0.64 | $100,000 | 2.24 |
| Louisville-Jefferson County, KY-IN | 16 | $275,000 | $402,500 | 0.84 | $491,537 | 0.55 | $111,500 | 2.42 |
| Memphis, TN-MS-AR | 47 | $370,000 | $365,000 | 1.00 | $900,000 | 0.53 | $164,012 | 2.66 |
| Miami-Fort Lauderdale-Miami Beach, FL | 529 | $180,250 | $199,000 | 0.91 | $398,243 | 0.59 | $95,000 | 2.05 |
| Milwaukee-Waukesha-West Allis, WI | 33 | $400,000 | $400,000 | 0.92 | $930,000 | 0.48 | $157,374 | 2.60 |
| Minneapolis-St. Paul-Bloomington, MN-WI | 98 | $204,500 | $224,950 | 0.95 | $456,673 | 0.69 | $121,756 | 2.39 |
| Nashville-Davidson--Murfreesboro, TN | 113 | $199,000 | $225,000 | 0.91 | $480,000 | 0.58 | $100,000 | 2.25 |
| New Haven-Milford, CT | 22 | $232,000 | $239,000 | 0.93 | $812,576 | 0.61 | $118,000 | 2.15 |
| New Jersey | 382 | $295,000 | $325,000 | 0.90 | $700,000 | 0.53 | $144,000 | 2.21 |
| New Orleans-Metairie-Kenner, LA | 5 | $125,000 | $159,000 | 0.79 | $238,000 | 0.53 | $53,506 | 2.34 |
| New York-Northern New Jersey-Long Island, NY-NJ-PA | 745 | $290,000 | $315,000 | 0.89 | $655,000 | 0.56 | $146,650 | 2.25 |
| Oklahoma City, OK | 30 | $270,000 | $322,500 | 0.89 | $570,201 | 0.49 | $147,500 | 2.29 |
| Orange County, CA | 285 | $179,000 | $195,000 | 0.91 | $350,000 | 0.57 | $86,000 | 2.12 |
| Orlando-Kissimmee, FL | 237 | $140,000 | $155,000 | 0.91 | $300,000 | 0.61 | $97,688 | 2.03 |
| Philadelphia-Camden-Wilmington, PA-NJ-DE-MD | 209 | $300,000 | $327,000 | 0.94 | $612,000 | 0.57 | $157,000 | 2.30 |
| Phoenix-Mesa-Scottsdale, AZ | 262 | $177,500 | $197,500 | 0.93 | $337,160 | 0.60 | $97,500 | 2.04 |
| Pittsburgh, PA | 46 | $339,750 | $420,000 | 0.90 | $700,000 | 0.60 | $155,000 | 2.68 |
| Portland-Vancouver-Beaverton, OR-WA | 90 | $325,000 | $335,000 | 1.14 | $918,184 | 0.50 | $135,219 | 2.53 |
| Providence-New Bedford-Fall River, RI-MA | 45 | $364,000 | $349,500 | 0.93 | $769,964 | 0.61 | $156,100 | 2.80 |
| Raleigh-Cary, NC | 57 | $350,000 | $395,000 | 0.94 | $609,000 | 0.60 | $144,622 | 2.39 |
| Richmond, VA | 22 | $196,500 | $225,000 | 0.87 | $506,534 | 0.47 | $113,381 | 2.02 |
| Riverside-San Bernardino-Ontario, CA | 151 | $188,500 | $207,250 | 0.92 | $411,888 | 0.59 | $92,000 | 2.13 |
| Rochester, NY | 25 | $145,000 | $145,000 | 0.93 | $287,406 | 0.54 | $74,776 | 2.15 |
| Sacramento--Arden-Arcade--Roseville, CA | 84 | $200,000 | $210,000 | 0.95 | $408,000 | 0.56 | $108,000 | 2.23 |
| Salt Lake City, UT | 78 | $274,500 | $310,000 | 0.91 | $546,528 | 0.59 | $120,728 | 2.58 |
| San Antonio, TX | 45 | $150,000 | $154,000 | 0.93 | $611,993 | 0.56 | $125,000 | 2.03 |
| San Diego-Carlsbad-San Marcos, CA | 158 | $220,000 | $250,000 | 0.92 | $507,000 | 0.47 | $108,000 | 1.98 |
| San Francisco-Oakland-Fremont, CA | 150 | $217,000 | $247,000 | 0.89 | $534,250 | 0.56 | $120,000 | 2.10 |
| San Jose-Sunnyvale-Santa Clara, CA | 79 | $210,000 | $249,750 | 0.88 | $500,214 | 0.54 | $114,248 | 2.26 |
| Seattle-Tacoma-Bellevue, WA | 136 | $216,000 | $235,000 | 0.95 | $531,254 | 0.57 | $92,474 | 2.73 |
| St. Louis, MO-IL | 31 | $187,500 | $199,450 | 1.05 | $617,793 | 0.46 | $113,872 | 2.38 |
| Tampa-St. Petersburg-Clearwater, FL | 487 | $295,000 | $295,000 | 0.97 | $457,609 | 0.89 | $122,253 | 2.63 |
| Tucson, AZ | 30 | $237,500 | $250,000 | 1.09 | $559,879 | 0.64 | $151,635 | 2.32 |
| Tulsa, OK | 11 | $475,000 | $500,000 | 0.99 | $905,807 | 0.74 | $164,282 | 2.38 |
| Virginia Beach-Norfolk-Newport News, VA-NC | 33 | $225,000 | $250,000 | 0.92 | $435,500 | 0.57 | $100,000 | 2.52 |
| Washington-Arlington-Alexandria, DC-VA-MD-WV | 185 | $250,000 | $275,000 | 0.91 | $600,000 | 0.56 | $130,000 | 2.25 |
| Wichita, KS | 4 | $378,000 | $375,000 | 1.01 | $528,000 | 0.72 | $131,000 | 2.89 |
| Winston-Salem, NC | 4 | $562,500 | $627,500 | 0.90 | $637,116 | 1.27 | $178,316 | 2.98 |
Source: Small business transactions reported on BizBuySell.com during 2017
Return to topClosed Small Business Transaction Metrics by Sector for the Full-Year 2017
Key metrics from transactions reported on BizBuySell.com by sector during 2017
| Sector | Sub-Sector | Number of Reported Sales | Median Sales Price | Median Asking Price | Sales to Asking Price (average) | Median Revenue | Revenue Multiple (average) | Median Cash Flow | Cash Flow Multiple (average) |
|---|---|---|---|---|---|---|---|---|---|
| Agriculture | Agriculture | 5 | $1,227,500 | $1,258,000 | 0.89 | $880,292 | 1.20 | $204,535 | 5.02 |
| Construction | Building | 221 | $470,000 | $500,000 | 0.96 | $1,110,669 | 0.48 | $235,000 | 2.18 |
| Construction | Heavy | 8 | $800,000 | $900,000 | 0.94 | $1,503,200 | 0.44 | $407,371 | 1.97 |
| Electric, Gas, Water, Sanitary Svcs | Electric, Gas, Water, Sanitary Svcs | 30 | $450,000 | $447,000 | 0.94 | $645,627 | 0.85 | $205,444 | 2.54 |
| Internet | Domain Name/Basic Site | 32 | $437,000 | $437,000 | 1.00 | $519,314 | 1.18 | $134,600 | 3.08 |
| Internet | Software | 17 | $390,000 | $390,000 | 0.94 | $399,070 | 1.26 | $270,884 | 2.45 |
| Internet | Web Design/Tech Services | 364 | $349,000 | $350,000 | 0.97 | $481,000 | 1.06 | $136,200 | 2.91 |
| Manufacturing | Apparel & finished fabrics | 17 | $649,500 | $629,000 | 0.88 | $1,021,611 | 0.57 | $207,573 | 2.83 |
| Manufacturing | Chemicals & Allied Products | 5 | $775,000 | $1,047,500 | 0.95 | $400,253 | 1.56 | $211,118 | 4.36 |
| Manufacturing | Electronic & Electrical Equip. | 28 | $350,000 | $350,000 | 0.90 | $769,393 | 0.72 | $148,391 | 2.81 |
| Manufacturing | Fabricated Metal Products | 87 | $877,500 | $939,000 | 0.94 | $1,225,000 | 0.75 | $283,589 | 3.38 |
| Manufacturing | Food and Kindred Products | 36 | $227,500 | $272,450 | 0.90 | $442,500 | 0.54 | $102,500 | 2.69 |
| Manufacturing | Furniture and Fixtures | 17 | $326,500 | $348,750 | 0.91 | $907,477 | 0.69 | $221,842 | 2.40 |
| Manufacturing | Industrial & Comm. Machinery | 15 | $1,475,000 | $1,475,000 | 0.89 | $1,554,833 | 0.77 | $350,000 | 2.98 |
| Manufacturing | Lumber and Wood Products | 15 | $645,000 | $642,500 | 1.07 | $1,422,750 | 0.67 | $265,250 | 3.03 |
| Manufacturing | Miscellaneous | 86 | $550,000 | $600,000 | 0.91 | $799,994 | 0.69 | $198,467 | 2.85 |
| Manufacturing | Paper & Allied Products | 49 | $271,750 | $297,000 | 0.91 | $440,000 | 0.67 | $142,500 | 2.30 |
| Manufacturing | Petroleum Refining | 1 | $1,500,000 | $1,500,000 | 1.00 | $2,874,129 | 0.52 | $662,335 | 2.26 |
| Manufacturing | Printing, Publishing | 2 | $112,500 | $152,500 | 0.80 | $505,218 | 0.22 | $93,127 | 2.77 |
| Manufacturing | Rubber and Plastic Products | 6 | $507,500 | $545,000 | 0.84 | $567,884 | 0.91 | $212,591 | 2.51 |
| Manufacturing | Stone, Clay, Glass, Concrete | 21 | $849,000 | $849,000 | 0.97 | $1,177,929 | 0.68 | $280,536 | 2.79 |
| Manufacturing | Transportation Equipment | 7 | $1,987,500 | $2,145,000 | 0.91 | $2,700,000 | 0.78 | $450,000 | 3.77 |
| Mining | Mining | 3 | $3,000,000 | $3,000,000 | 1.03 | $3,897,692 | 1.00 | $647,600 | 4.16 |
| Retail | Apparel and Accessory Stores | 111 | $154,000 | $170,000 | 0.91 | $450,000 | 0.45 | $90,193 | 1.98 |
| Retail | Automotive Dealers | 37 | $335,000 | $387,000 | 0.98 | $1,075,868 | 0.47 | $143,000 | 2.24 |
| Retail | Bars/Taverns | 300 | $225,000 | $250,000 | 0.90 | $646,154 | 0.42 | $110,000 | 2.14 |
| Retail | Blding Mat., Hardware, Garden | 40 | $363,000 | $389,750 | 0.90 | $1,023,516 | 0.46 | $187,628 | 2.70 |
| Retail | Convenience Stores | 331 | $200,000 | $225,000 | 0.94 | $700,000 | 0.40 | $100,000 | 2.39 |
| Retail | Florists | 66 | $129,500 | $142,000 | 0.91 | $428,216 | 0.41 | $85,960 | 1.84 |
| Retail | Gasoline Service Stations | 378 | $359,950 | $385,000 | 0.94 | $1,700,000 | 0.45 | $148,878 | 3.40 |
| Retail | Home Furniture & Furnishings | 111 | $175,000 | $200,008 | 0.91 | $551,254 | 0.43 | $87,006 | 2.08 |
| Retail | Liquor Stores | 352 | $347,500 | $370,000 | 0.92 | $800,000 | 0.48 | $120,000 | 3.03 |
| Retail | Marine Dealers & Equipment | 20 | $320,000 | $320,000 | 0.94 | $508,838 | 0.89 | $152,522 | 2.51 |
| Retail | Miscellaneous Retail | 318 | $175,000 | $195,000 | 0.93 | $441,257 | 0.53 | $95,865 | 2.28 |
| Retail | Other Eating & Drinking Places | 727 | $155,278 | $179,000 | 0.89 | $431,861 | 0.43 | $92,660 | 2.00 |
| Retail | Pet Shops & Supplies | 28 | $139,600 | $145,000 | 0.89 | $265,369 | 0.43 | $84,443 | 2.09 |
| Retail | Restaurants | 1894 | $185,000 | $199,000 | 0.91 | $543,977 | 0.39 | $100,000 | 2.07 |
| Retail | Supermarkets | 72 | $151,000 | $151,000 | 0.99 | $400,000 | 0.38 | $72,540 | 2.55 |
| Retail | Vending Machines | 129 | $115,000 | $124,000 | 0.94 | $328,955 | 0.58 | $69,922 | 1.85 |
| Service | Agents & Brokers | 3 | $365,000 | $365,000 | 0.97 | $1,214,099 | 0.82 | $192,857 | 2.81 |
| Service | Amusement & Recreation | 105 | $207,500 | $250,000 | 0.86 | $401,992 | 0.77 | $109,451 | 2.37 |
| Service | Auto Repair, Parts & Services | 350 | $300,000 | $350,000 | 0.90 | $562,000 | 0.70 | $129,977 | 2.64 |
| Service | Beauty Salons, Barber Shops | 386 | $120,000 | $135,000 | 0.90 | $290,756 | 0.47 | $75,000 | 1.75 |
| Service | Computer & Software Services | 37 | $410,000 | $430,000 | 0.86 | $560,985 | 0.70 | $182,990 | 2.46 |
| Service | Drycleaning/Laundry Services | 357 | $195,000 | $210,000 | 0.91 | $245,652 | 0.96 | $80,000 | 2.80 |
| Service | Educational Services | 178 | $342,450 | $350,000 | 0.91 | $461,250 | 0.85 | $122,194 | 3.08 |
| Service | Engineering & Accounting Svcs | 82 | $260,000 | $270,000 | 0.96 | $263,000 | 0.94 | $140,000 | 2.04 |
| Service | Finance, Banking, Loans, etc. | 62 | $243,000 | $275,000 | 0.89 | $294,872 | 1.03 | $135,008 | 2.19 |
| Service | Freight, Moving/Delivery | 212 | $540,000 | $590,000 | 0.94 | $729,320 | 0.74 | $184,808 | 2.87 |
| Service | Health, Medical & Dental | 454 | $315,000 | $365,000 | 0.89 | $571,000 | 0.67 | $155,034 | 2.39 |
| Service | Hotels & Other Lodging Places | 100 | $537,500 | $635,000 | 0.92 | $424,829 | 1.54 | $150,271 | 4.07 |
| Service | Landscaping & Yard Services | 192 | $155,000 | $180,000 | 0.92 | $325,000 | 0.64 | $100,000 | 1.77 |
| Service | Legal Services | 13 | $300,000 | $300,000 | 0.89 | $500,000 | 0.78 | $167,000 | 2.19 |
| Service | Miscellaneous Services | 59 | $305,000 | $335,000 | 0.89 | $715,000 | 0.60 | $175,000 | 1.96 |
| Service | Motion Pictures | 1 | $400,000 | $465,000 | 0.86 | $379,400 | 1.05 | $175,717 | 2.28 |
| Service | Museums, Art Galleries, Zoos | 5 | $380,000 | $404,500 | 0.96 | $457,998 | 0.80 | $136,359 | 2.62 |
| Service | Other Business Services | 919 | $187,000 | $222,500 | 0.92 | $347,918 | 0.66 | $115,057 | 2.02 |
| Service | Other Personal Services | 176 | $81,950 | $82,724 | 0.99 | $132,735 | 0.61 | $78,000 | 1.28 |
| Service | Other Travel & Transportation | 52 | $412,500 | $522,500 | 0.90 | $669,894 | 0.79 | $170,777 | 2.45 |
| Service | Passenger Transportation | 17 | $300,000 | $310,000 | 0.91 | $689,979 | 0.55 | $151,000 | 1.93 |
| Service | Pet Care & Grooming | 58 | $200,000 | $237,000 | 0.88 | $320,427 | 0.89 | $100,328 | 2.59 |
| Service | Storage & Warehousing | 10 | $500,000 | $480,000 | 0.98 | $1,080,891 | 0.66 | $243,000 | 2.94 |
| Service | Travel Agencies | 5 | $549,990 | $549,990 | 0.84 | $874,626 | 0.81 | $200,000 | 2.18 |
| Wholesale | Durable Goods | 93 | $425,000 | $462,495 | 0.94 | $1,144,168 | 0.53 | $178,410 | 2.71 |
| Wholesale | Nondurable Goods | 78 | $173,000 | $174,000 | 0.96 | $488,328 | 0.49 | $82,212 | 2.41 |
| Non-classifiable Establishments | Non-classifiable Establishments | 11 | $614,250 | $895,000 | 0.90 | $858,100 | 0.96 | $250,000 | 2.71 |
Source: Small business transactions reported on BizBuySell.com during 2017
Return to top
Media Contact:
Adam Debussy
BizBuySell
email: adebussy@bizbuysell.com
About BizBuySell
BizBuySell is the Internet's largest business for sale marketplace. Since 1996, BizBuySell has offered tools that make it easy for business owners and brokers to sell a business, and potential buyers to find the business of their dreams. BizBuySell currently has an inventory of approximately 48,000 businesses - spanning 80 countries - for sale at any one time and receives more than 1 million monthly visits. The site also features an extensive franchise directory as well as an easy-to-use business valuation tool. Please visit www.bizbuysell.com for more information.
BizBuySell was founded in 1996 and in 2012 became a division of CoStar Group, Inc. (NASDAQ - CSGP) - commercial real estate's leading provider of information and analytic services. CoStar conducts expansive, ongoing research to produce and maintain the largest and most comprehensive database of commercial real estate information and offers a suite of online services enabling clients to analyze, interpret and gain unmatched insight on commercial property values, market conditions and current availabilities. For more information, visit www.costar.com.